I previously use the default node debugger to debug nodejs app. It’s working all right, but at some point I still miss the ability to set break point on the fly.
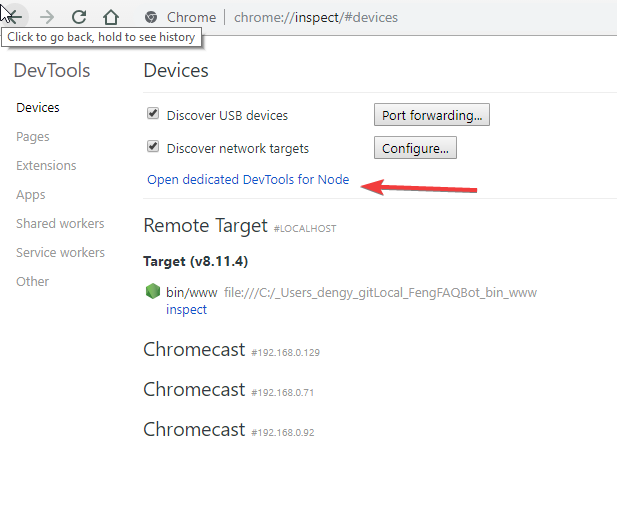
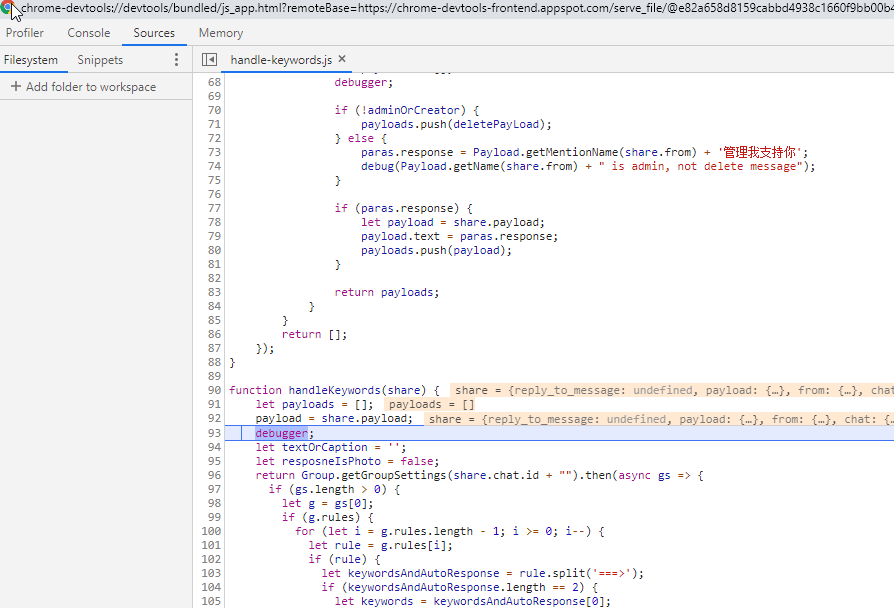
I tried to setup Google chrome as nodejs debugger. But the problem is that my source page of the Google Chrome devtool is always blank.
The reason is that
To use default nodejs debugger, the following command is used
node inspect bin/www
but for chrome, it should be
node –inspect bin/www
“inspect” is different from “–inspect”